6 August 2018

The international Paylab network, which includes 19 localised salary portals, has introduced an innovative way of salary data processing. The innovation lies in the use of regression models that improve the salary analyses and provide more comprehensive and detailed data on employee remuneration. This method makes it possible to extract much more information from the collected data and, according to the relationships between the individual datasets, better estimate salaries for job positions with insufficient salary data. It can also fully satisfy a wider range of clients interested in salary reports.
Payroll analyses are of interest to both employers and individuals. Companies usually want to verify whether they offer competitive remuneration for different job types.
Individuals want to find out if they earn an average salary, or to monitor the development of salaries for similar jobs in their region through the Paylab Salary Checker mobile app.
The new method can use the variables more complexly and reliably, thus providing clients with answers to questions such as the current salary "status quo" (average salary + salary range) for individual job positions with respect to region, experience, age, company size, and education.
On average, the Paylab.com international portal annually collects more than 550,000 salary entries for more than 450 job positions, which it stores in its database. The collected data samples for individual positions vary. So far, Paylab hasn't provided salary reports for positions where there were few respondents in certain regions. With the new regression model, which our team of analysts has been developing for almost a year, it can search for contexts in individual data parameters and logically conclude salary estimates even for regions where there is not much input data available - just on the basis of the total data collected.
How does the regression model work in practice?
We can imagine it as a map with data where correlations between the individual statistical parameters are tracked. These correlations can be grouped into patterns and combined. For example, we know the general progression/growth of an accountant's salary in Slovakia according to experience, but in some regions we don't have enough data from senior accountants. Now we can estimate their salaries based on information from senior accountants in other regions.
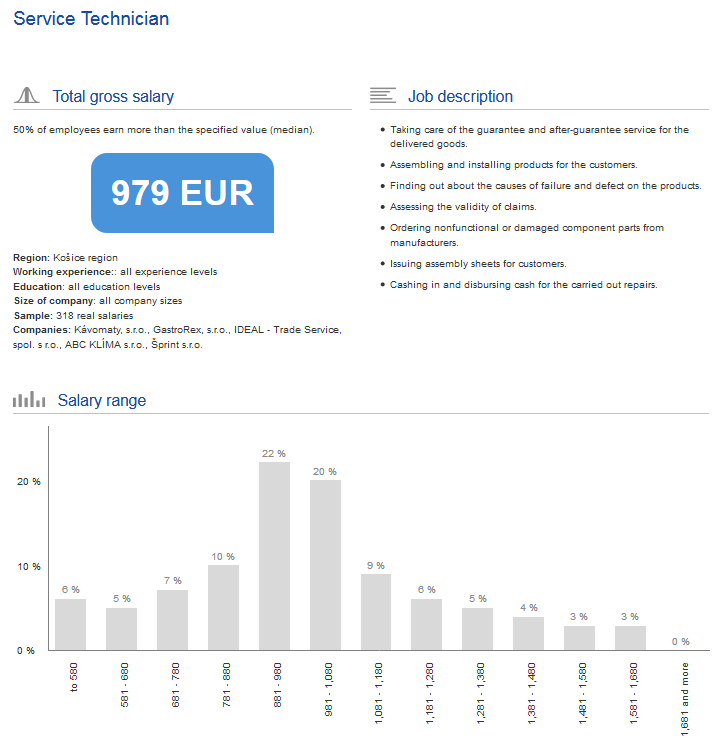
With job positions, the method is similar. For example, the client needs to find a salary for service technicians in the Košice region in Slovakia. Let's say the Platy.sk database includes only five salary data entries for this particular position and region, but in other regions there are 313 salary questionnaires from service technicians available. The Paylab regression model can use the existing correlations and parameters for all real salaries of service technicians from other regions in the database and simulate them for the Košice region, taking into account the average salary in the given region.
What does the current salary analysis look like?

The regression model takes into account salary calculation inputs based on the following parameters:
- position
- region
- age
- company size
- education
- sex
- experience
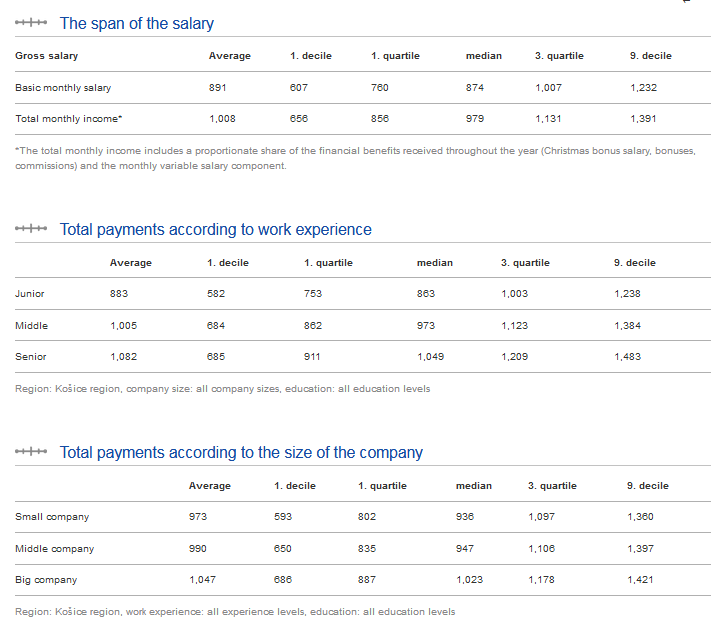
The salary analysis includes a salary spread for a job position, specifically the basic salary, as well as the total salary including financial rewards earned during the year.
Clients of the service will get a detailed picture of the distribution of employees for the given job position into wage ranges - the shares of people in individual income groups.
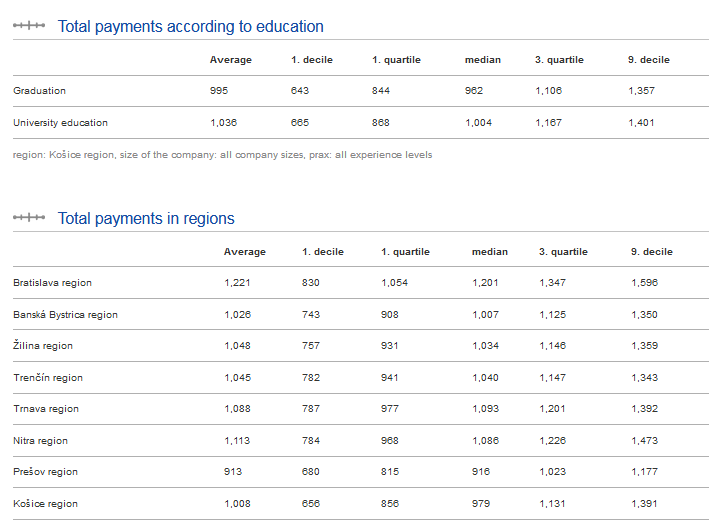
The salary report further shows an overview of the total salaries of people in the given job position according to experience, company size, education, region, and age.
All this data is further elaborated into deciles, quartiles, and a median, so the client knows what the median salary in the region is and how much a tenth of the worst and best earning employees earn based on the above-defined parameters.
In addition to salaries, the client will also have an overview of what share of employees in the given job position receives financial benefits and what their average value is (13th salary and rewards). For a comprehensive picture of the employee remuneration system, the salary report also includes an overview of the prevalence of non-financial benefits that employers usually provide for the given job position.
What is regression analysis?
Regression analysis looks for correlations between different values. If such a correlation exists, a mathematical formula describing the correlation is calculated. Paylab uses a regression model that combines elements of linear, polynomial, and quantile regression.
Linear regression is the simplest form of regression modelling. It examines, for example, the relationship between the salary and years of experience - the longer the experience, the higher the salary. In linear regression, a "line" is calculated across the data to describe as closely as possible the correlation between the salary and years of experience. The mathematical formula is: "At 0 years of experience, the salary is X euros. For each additional year of experience, the salary is Y euros higher".
In addition, we use polynomial regression, which can integrate more complex correlations into the computational formulas, such as the fact that the development of experience is more dynamic right after entering the labour market, tends to grow more slowly after acquiring certain experience and, in certain types of positions, increases even in higher ages with seniority.
Quantile regression does not use average values, instead using percentiles in the calculations.

About Paylab
Paylab.com was set up in September 2015 and operates 19 local salary portals utilising identical data acquisition methodology, mostly in the Central Southern and Northern Europe. It also provides people from around the globe with the opportunity to compare their salary at Paylab.com. Paylab's ambition and vision is to provide long term up-to-date global salary data with a focus on Europe and developing markets in Africa, Asia and the Pacific. We have seen increased demand for a similar salary comparison service throughout the region.
The first salary portal Platy.sk was launched by Profesia in Slovakia in 2007, creating a salary data collection, clean-up and evaluation system, and methodology. A network of local salary portals was subsequently created in local languages in Central Europe (Hungary, Czech Republic, Poland), the Balkans (Croatia, Serbia, Bosnia & Herzegovina, Slovenia, Montenegro, Bulgaria, Romania), the Baltics (Estonia, Latvia, Lithuania), Finland, France, Nigeria and Ivory Coast. The Paylab brand is part of the Finnish Alma Media group.